Analysis of Engagement, Share of Voice and type of content published in the last quarter of 2017
The year 2017 has come to an end and we could not dismiss it without making a brief analysis of the profiles in social networks of the major Spanish distribution brands that have stood out for their engagement performance on Facebook and Twitter.
But before looking at the analysis, we will clarify what engagement is. Engagement represents the degree of involvement of the community with the brand and it is achieved with an adequate social media strategy, good contents and following up with the community of fans. The interactions with the posts: likes, replies and retweets in the case of Twitter or reactions, comments and shares in the case of Facebook, are divided by the size of the community (fans or followers) and by the number of posts published. The result is the engagement metric.
Next we present a graph of interactions recording the main actions of the analyzed brands, accompanied by a KPIs table where the brands are ranked by engagement. The data refers to the activity of the last four months of 2017:
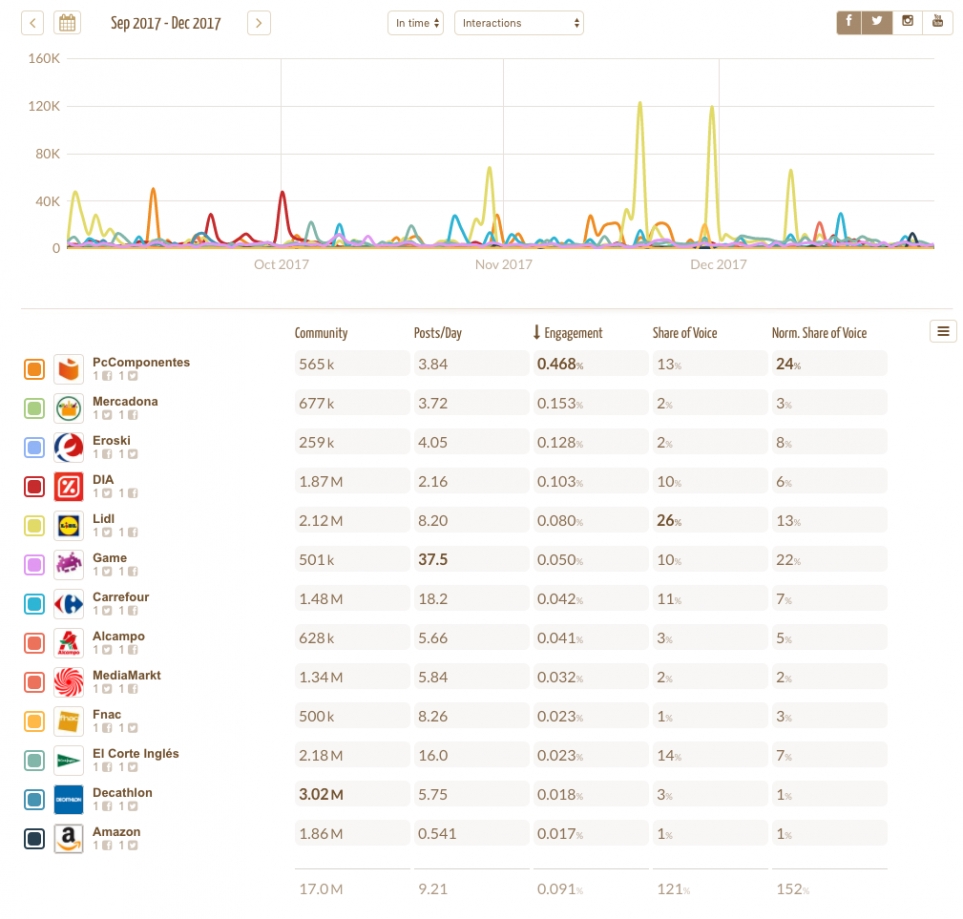
Graph of interactions and KPIs table of the main Spanish distribution brands analyzed. The data refers to public posts, it does not include the activity related to "dark posts".
As we can see, the brands that stand out are PcComponentes, Mercadona, Eroski and Dia, which have a value of engagement above 0.1%. If we look at the breakdown of Facebook and Twitter data, we realize how Zuckerberg's social network normally offers better engagement performance. Although surprisingly, in the case of PcComponentes, both platforms register very similar values . In this last four-month period of 2017, PcComponentes also shines due to its positive trend: engagement has grown by 123% and the community has grown by more than 10%.
It is also interesting to analyze the type of customer service offered by these major brands, reflected by the daily conversation metric, i.e., the number of tweets that brands direct to their followers to provide information or to resolve incidents. We highlight Mercadona and PcComponentes, with almost 50 daily conversations, when most of the competitors do not even reach 10.
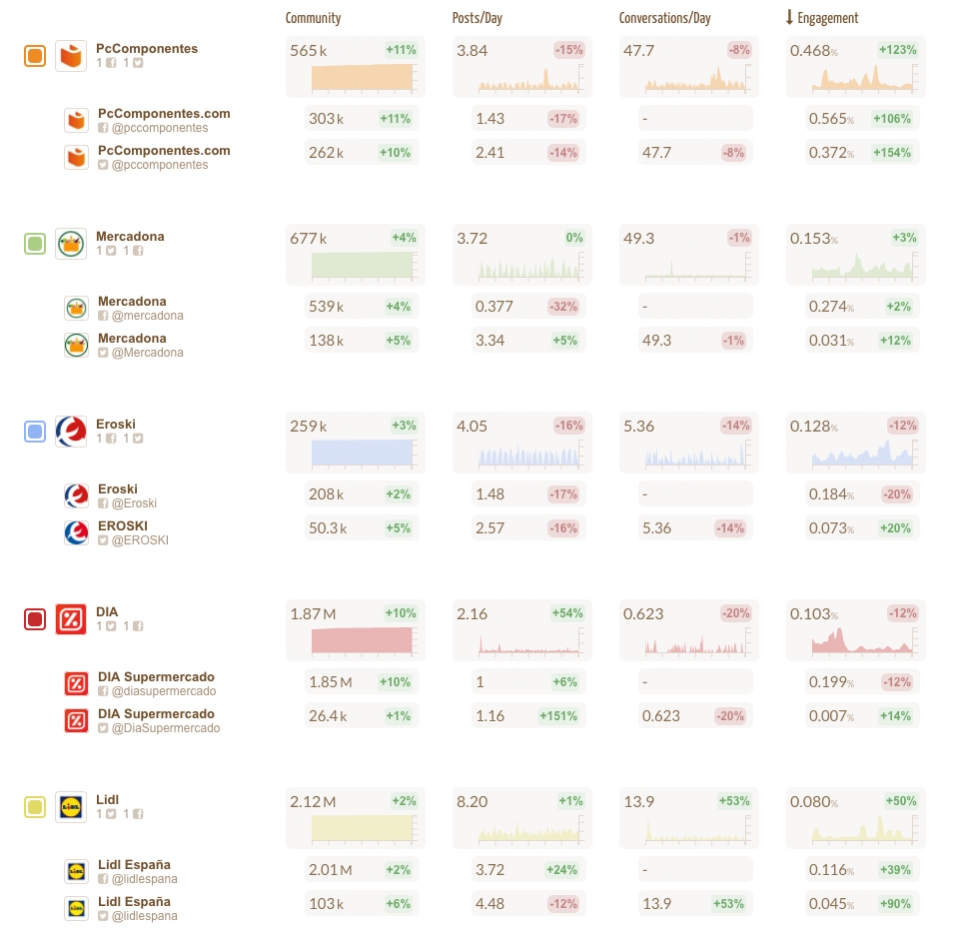
Breakdown of KPIs by the contribution of each of the two social networks analyzed. Number of fans / followers, activity (publications and conversations with the community) and engagement performance.
Having a very large community usually ensures a good result of Share of Voice (SoV), as would be the case of Lidl and El Corte Inglés. Their social networks contribute, respectively, with 26% and 14% (SoV) of all the "social noise" generated by the brands analyzed. But if we look at the emblematic case of Decathlon, we see how having the largest community does not imply having an impact in terms of SoV, due to the low level of engagement and also the low frequency of publications.
The "SoV Normalized" (NSoV) metric helps us to recalculate what the Share of Voice would be if all the brands analyzed had the same community size, as well as to highlight the competitors that have an optimized strategy and greater potential. In this case, the brands that have obtained the best results in their profiles would be: PcComponentes (24%), followed by Game (22%) and Lidl (13%). In the case of Game, success is determined by the large amount of content generated (almost 40 posts a day), despite not having a particularly good engagement.
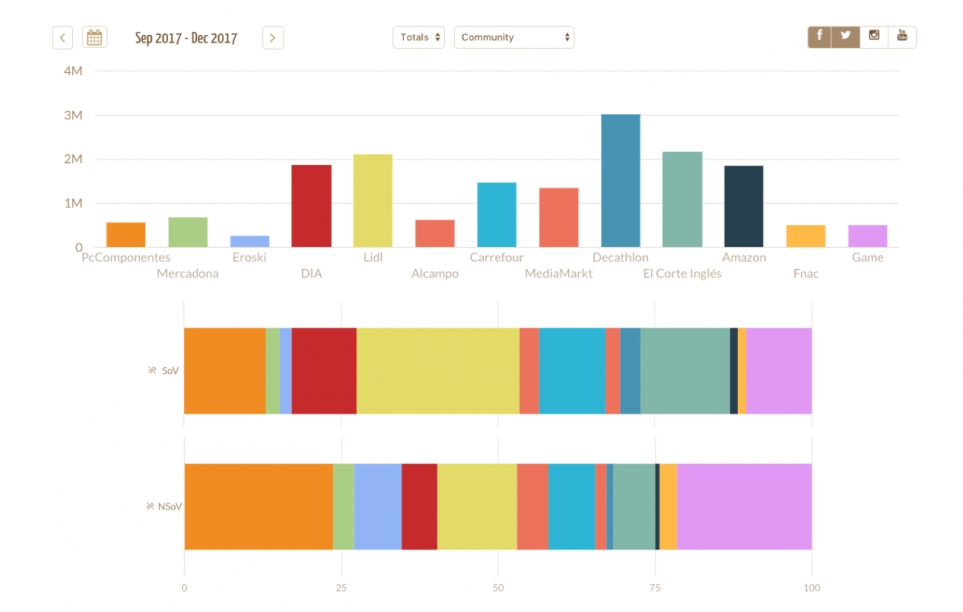
The top image indicates the community size (sum of Facebook Fans and Twitter Followers) of the brands analyzed. The center image shows the Share of Voice (SoV), which reflect the brands that generate more social noise. The last image displays the data of the Normalized Share of Voice (NSoV) to compare which brands have the most potential.
We complemented this sector study with some qualitative data about the type of content that these brands have shared in this last four-month period. Analyzing the most successful posts of the brands, we have detected the popular topics/words appearing in the publications. The most popular #hashtags reflect the main campaigns, most powerful actions of each brand, and generic #hashtags such as #blackfriday and #starwars. It seems giveaways are also very popular, as displayed by the tag cloud.
It is also interesting to discover where distribution brands redirect traffic. Typically, we find links to corporate web pages, YouTube videos and also EasyPromo, a resource for the management of contests in social networks.
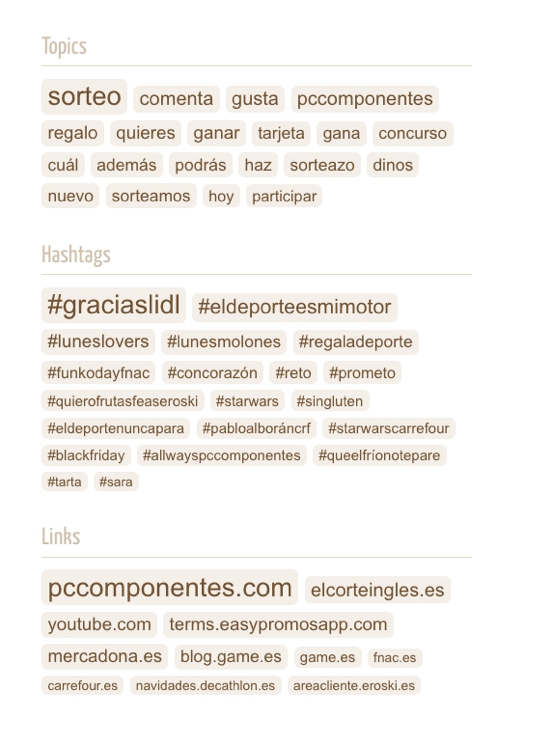
Frequent topics, #hashtags and most popular links of the analyzed brands.
Finally, we analyze the most used formats. Surprisingly, we found that in this sector, the video format was not the winner. Photos or texts with Links are used more frequently instead. If we isolate only Facebook data, then the videos have prevalence over the Links, but are not as popular as the photos.
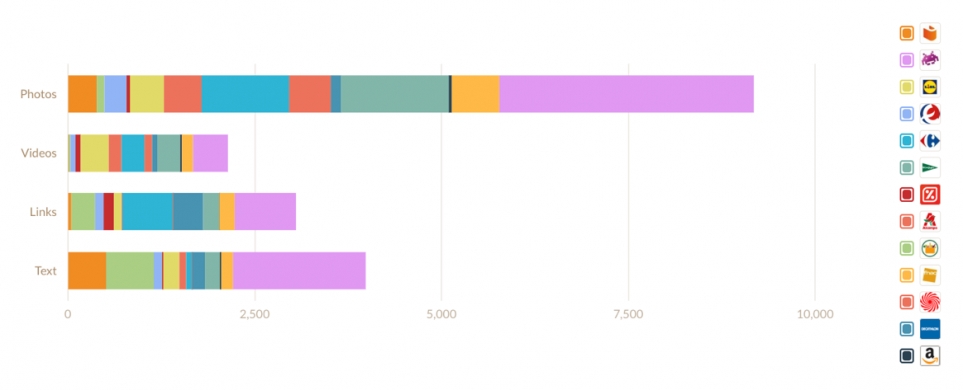
Formats of the publications of the brands analyzed.