Social Elephants allows you to compare Social Media ROI with traditional media.
When analyzing the performance of a Facebook Page we can extract a breakdown of the impressions of our posts to understand how much of it it's coming from investing in Facebook Ads and how much it's actually organic and viral. This type of analysis it's very helpful to develop a strategy and understand the potential of a community but it's very difficult to compare these figures with other type of media.
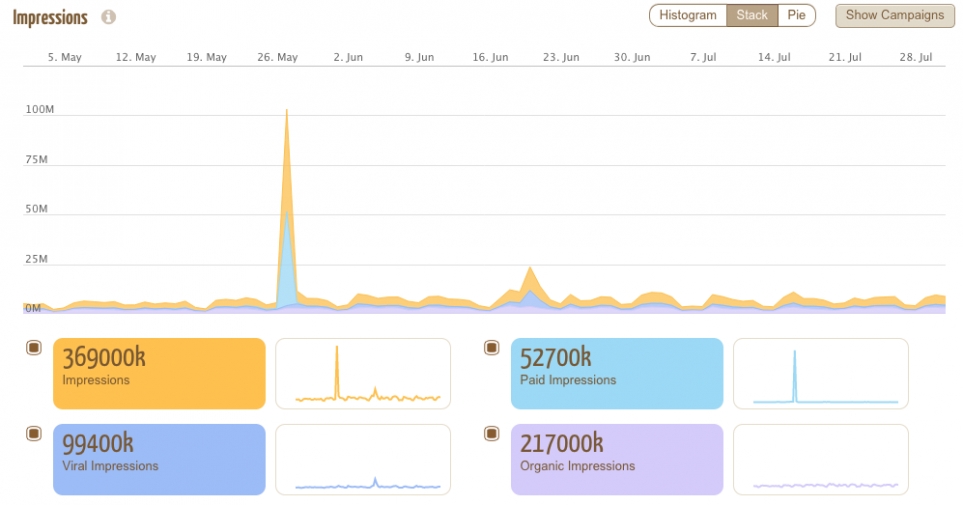
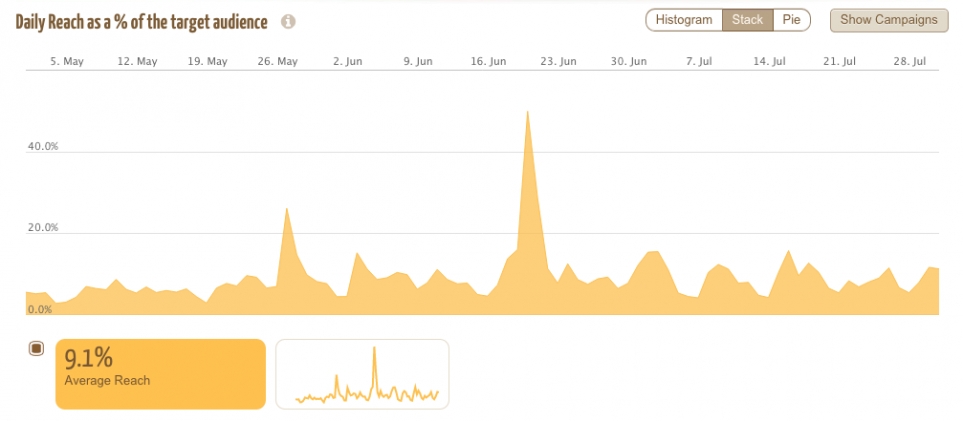
Of all this impressions (views of a post) it's very helpful to identify the amount of unique users (Reach) who actually viewed the content and to have it expressed as a percentage of the target audience of your brand. Once you set up the channel universe in the channel settings, Social Elephants automatically plots this handy graph for you. Then you can already understand how much of your target audience has been covered by a specific campaign and you can compare figures with the audience of Television or press.
We can observe in the example here below how Facebook provides a coverage of an average of 9% of the target of potential customers with peaks up to 50%: this reveals how Social Media clearly compete with traditional media when addressing your customers becomes a key objetive.
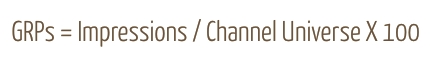
Another key unit for marketers is the Gross rating point (GRP): it is a term used in advertising to measure the size of an advertising campaign. It does not measure the size of the audience reached. Rather, GRPs quantify impressions as a percentage of the target population.
GRPs are used predominantly as a measure of media with high potential exposures or impressions and therefore we should be able to calculate the GRPs for a Social Media campaign.
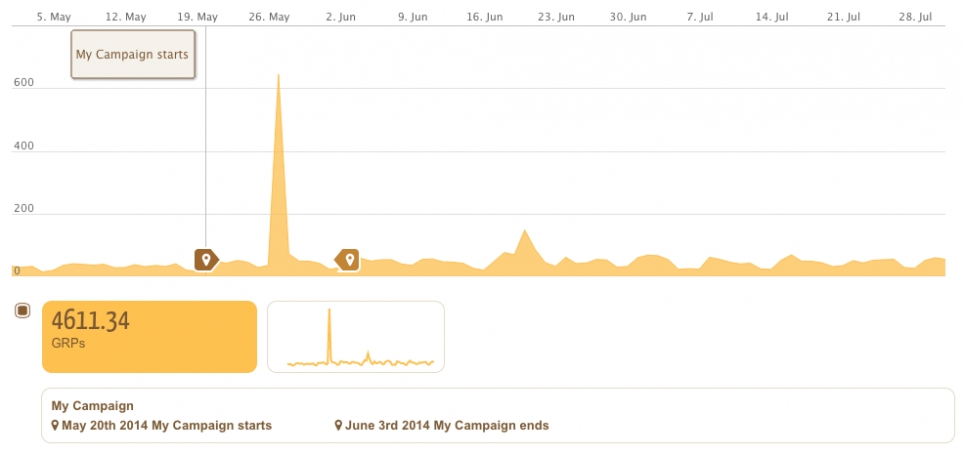
In the Insights of Social Elephants we can find a graph representing the GRPs generated and we can easily recognize peaks associated to specific campaigns, as shown in the example here below. During the selected period of 3 months we have a total of more than 4600 GRPs and we want to calculate how much of that comes from the campaign labelled "My Campaign" and starting on May 20th.
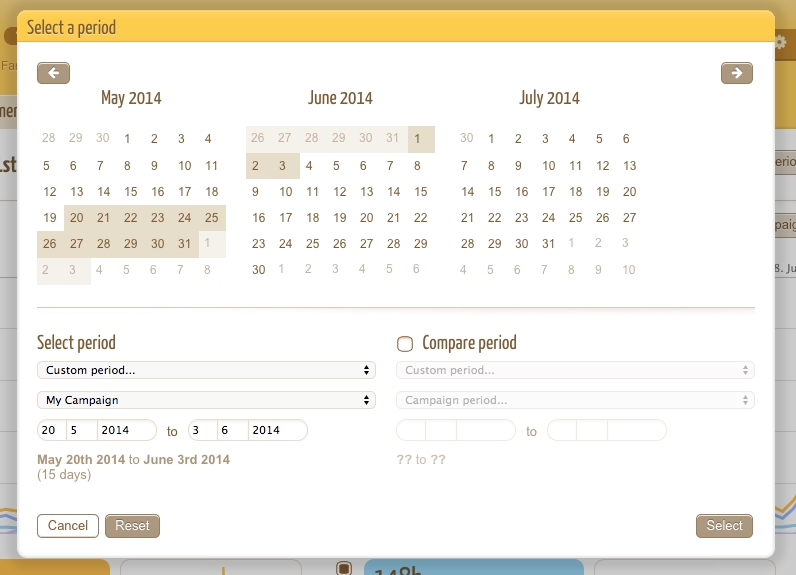
Then we can easily select the desired Campaign Period in the drop down menú:
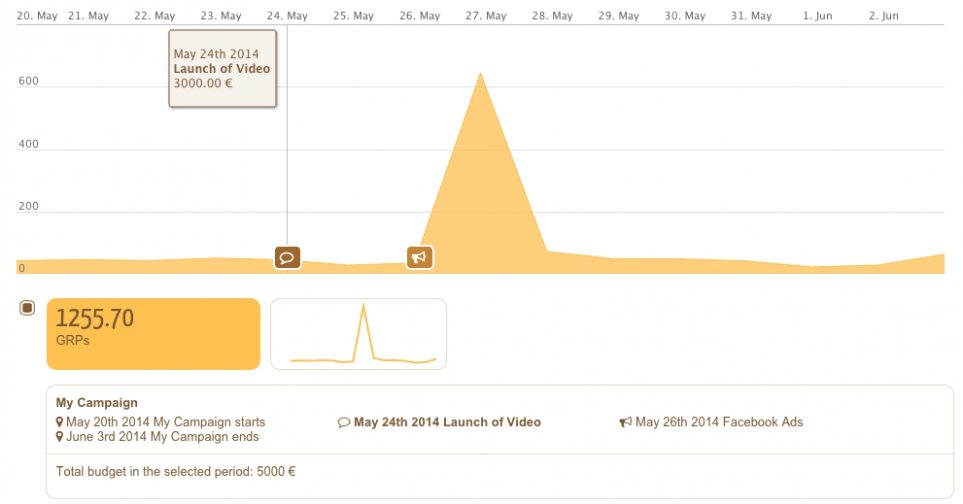
Then we get a detailed overview of "My Campaign" , involving a video launched on May 24th and a Facebook Ads campaign on May 26th, as shown from the markers on the graph.
In the box we can find out that this campaign corresponds to 1256 GRPs.
If we know the budget involved in running the Facebook Page during the selected time (in this example we could include the production of the video, the budget invested in Facebook Ads and the salary of the Social Media staff) then it's straightforward to calculate the Cost per GRP, which turns out to be surprisingly much cheaper than other traditional media.
This is a great opportunity for a Social Media Manager to prove the ROI and to drive more budget for his department.