Check if you are reaching your objectives month by month
Track the performance of your social channels month by month with our yearly KPIs table!
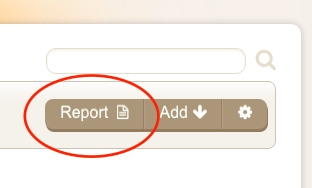
You can access to our exclusive reports directly from the dashboard:
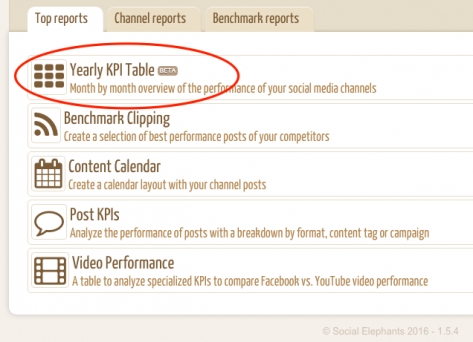
Within the different available reports you can pick the "Yearly KPI Table":
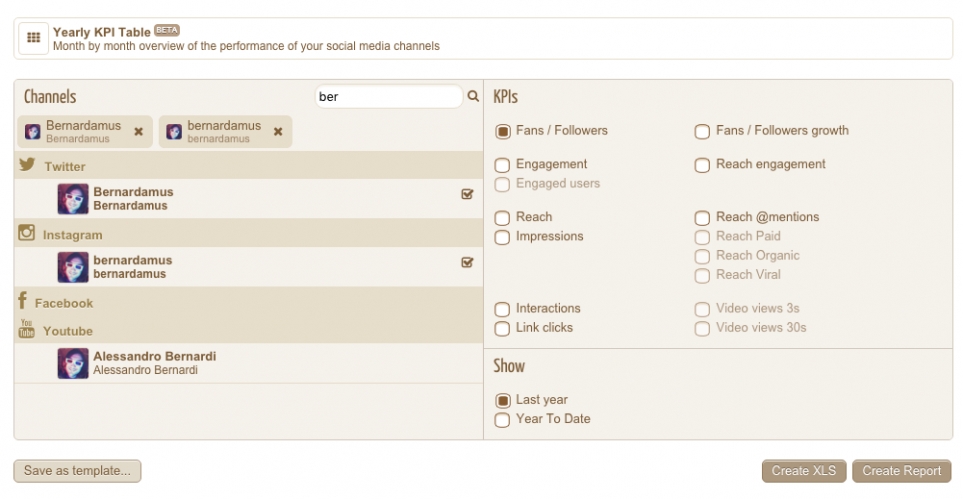
On the left-hand side of the screen you can select the social channels that you want to analyze. A search box helps you to quickly find the brand that you are looking for within the complete list of channels.
On the right-hand side you can choose the metrics that you want to display in the results table. Depending on the social network, apart from the general KPIs, you can select other specialized metrics. Moreover, it's possible to include in the table a comparison with the previous year results or the cumulative indicators (Year To Date) all year long.
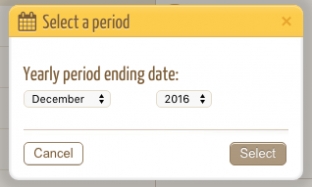
It's possible either to export the report in excel format using the "Create XLS" button, or to display it on screen with the button "Create Report". A pop up window permits to select the last month that is displayed in the report.
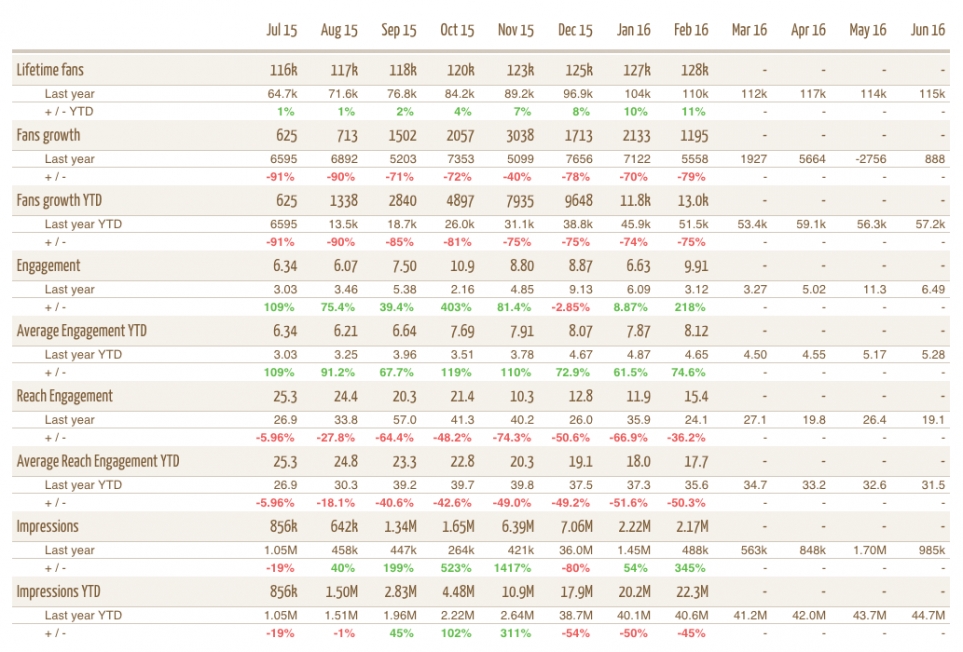
The KPIs table obtained is very useful to follow the evolution of different KPIs month by month and to point out variations along the yearly activity. Different colors help to highlight those months when positive results are achieved (green) and months when there is a decay of the performance (red) when compared with the results of previous year.