Customize your table of KPIs according to your objectives of Reach, Engagement and Web Traffic.
Discover the best performing content strategy that is helping you to achieve your objectives in the social networks with the new POST REPORT, a complete and detailed overview of your activity on Facebook, Twitter, Instagram and YouTube.
The POST REPORT extracts data from the different social networks that we are managing and provides a useful and fully customizable table of KPIs (also available in Excel format).
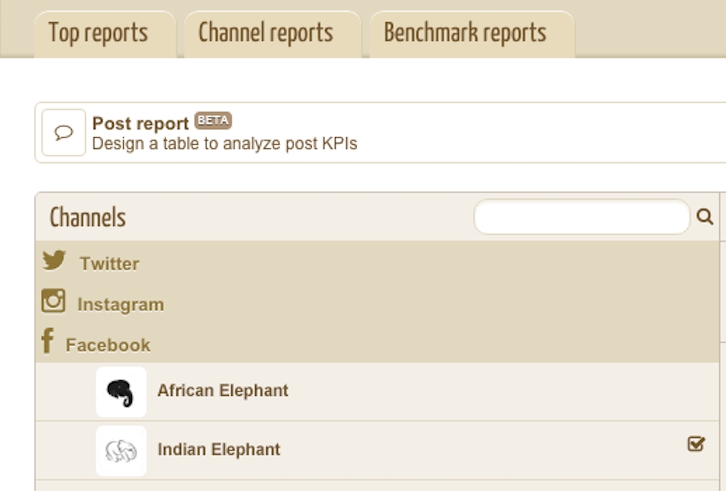
The first step consists in the selection of the social channels (facebook pages, twitter accounts, etc) which are going to be used as source of data, with the possibility to combine and summarize the results coming from different platforms in the same KPI table.
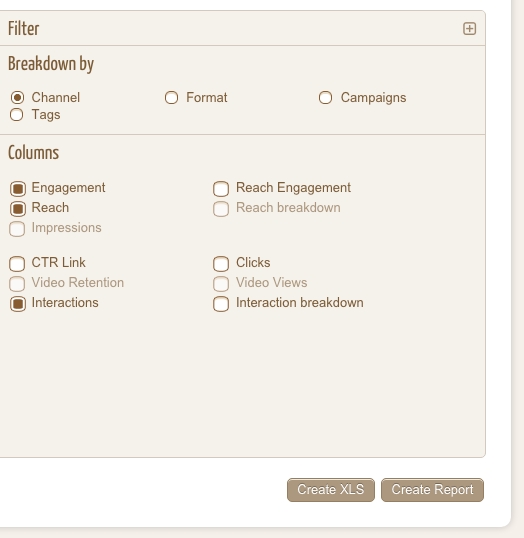
The second step consists in the selection of the metrics that we are interested to include in our report, with the option to choose from a range of KPIs of engagement, reach, web traffic and video performance.
A powerful filter allows to focus the analysis on selected contents, searching for specific keywords or using content TAGs previously assigned to our posts. The filter offers a variety of options to prepare reports meant to point out the takeaways of our content strategy.
Moreover, depending on our needs, we have the option to easily group data by social channel, by format (video, foto, link, ...), campaign and content TAG.
Finally, when we are ready to generate the report, we can select the range of dates that we are interested to analyze and we have the option to export the KPIs table directly in excel format.
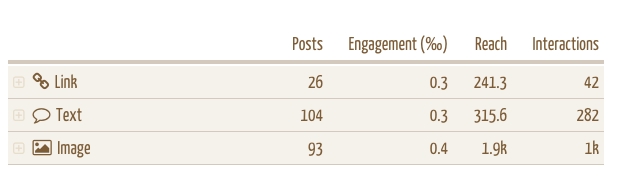
Grouping results by format allows to understand how to optimize our activity according to our objectives, for example, we can point out if images really generate better engagement than other formats, or get clues on how to maximize the reach of our publications.
If we need a big statistical data sample, we can combine data coming from different social channels and different social networks, or we can filter content according to our needs.
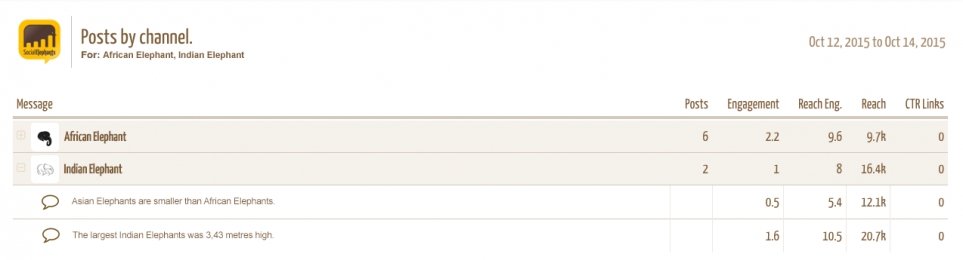
By clicking the "+" button we can expand the table with a detailed view of all the posts that contribute to the resulting average KPIs.
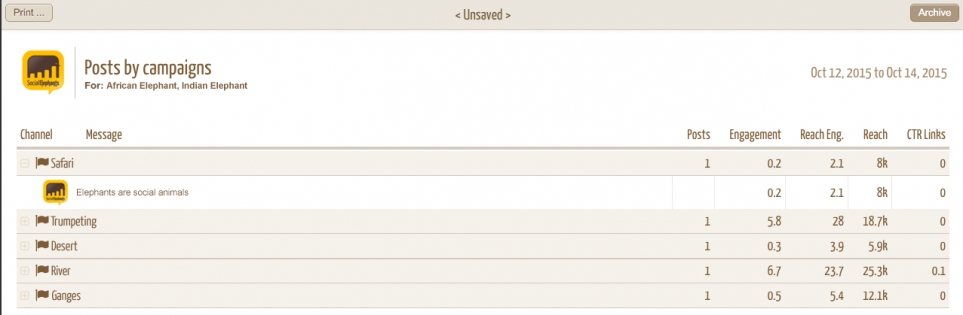
By selecting the breakdown by campaign it's possible to benchmark the results of our campaigns among different social channels or even different social networks.
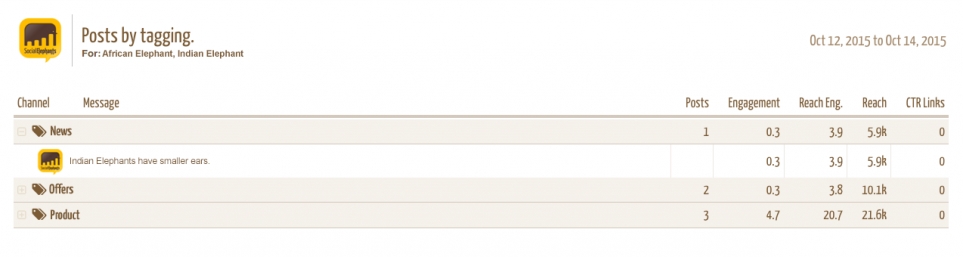
By grouping by TAG we can quickly point out the best performing topics or types of content.
The classic breakdown by channel is very useful to build a benchmark table of all the brand social properties that we manage. In Social Elephants we developed universal metrics that allow a quick and straightforward comparison of performance for an easy strategic decision making.