Create your reports taking advantage of our inspiring templates and intuitive graphs
The Social Elephants reports include intuitive graphs that allow you to easily capture the most relevant trends among all the information stored in the results tables. You can export the data in excel format, share the information with a practical link or print your report in PDF.
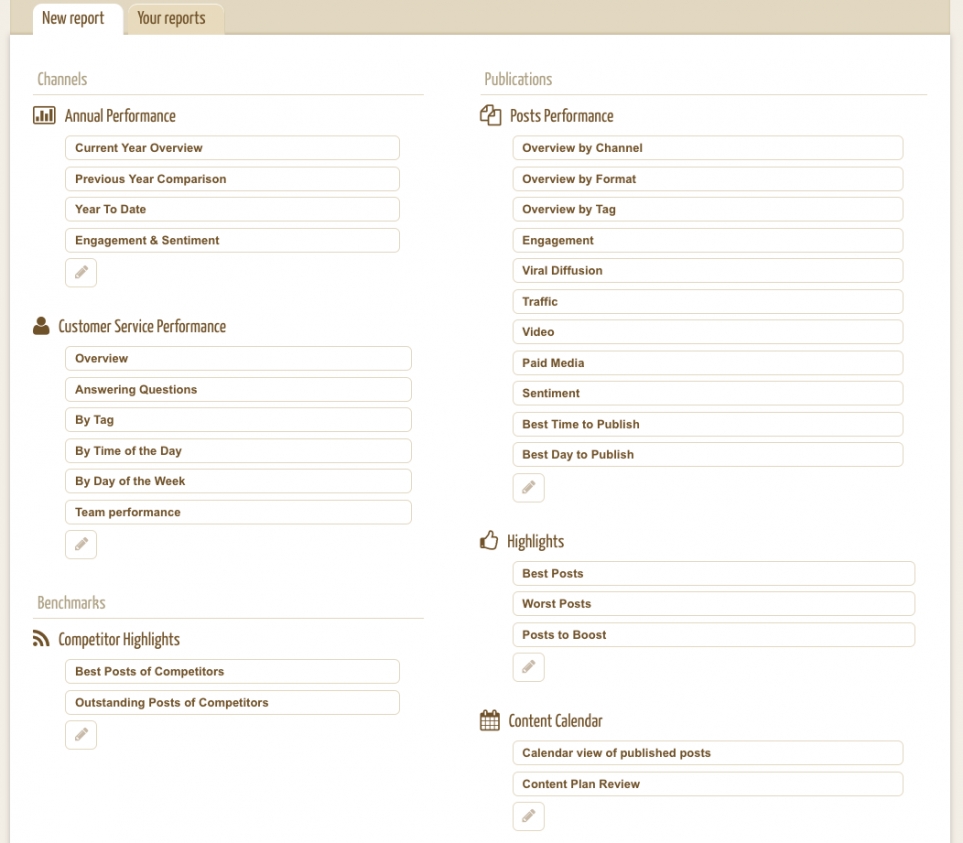
You have different types of reports available to analyze all aspects of your activity in the social networks and you can find templates that can inspire new and useful types of reports that you have probably not thought of before, such as:
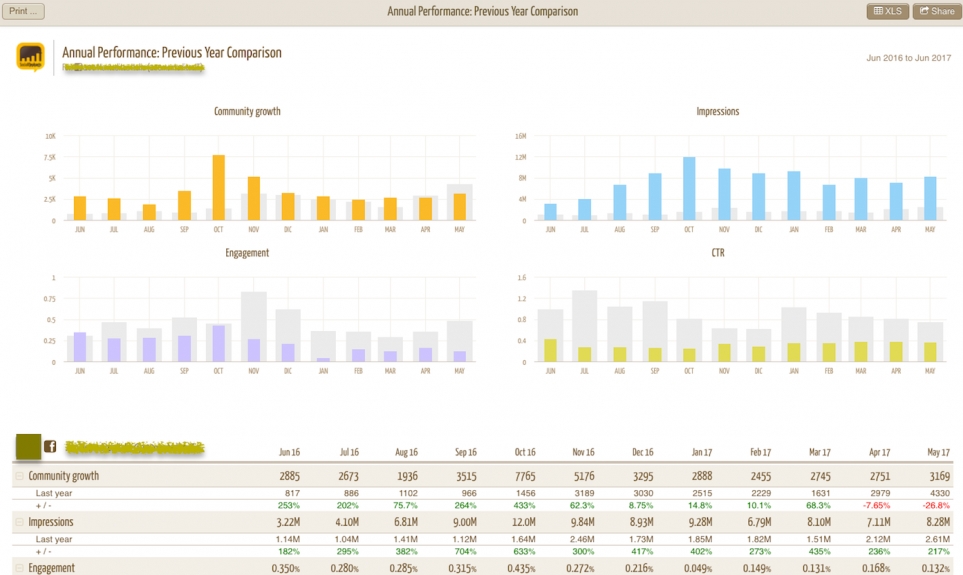
- Comparison with last year's activity (Previous Year Overview)
- Recommendations on where to invest in Ads (Posts to Boost)
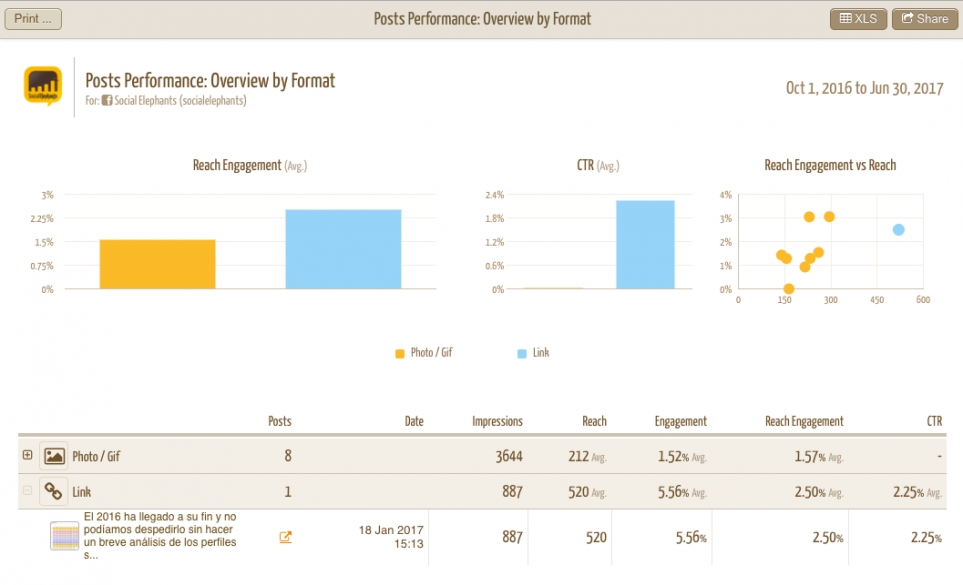
- Analysis of the formats that work best (Overview by Format)
- Investigation of the viral diffusion of your publications (Viral Diffusion)
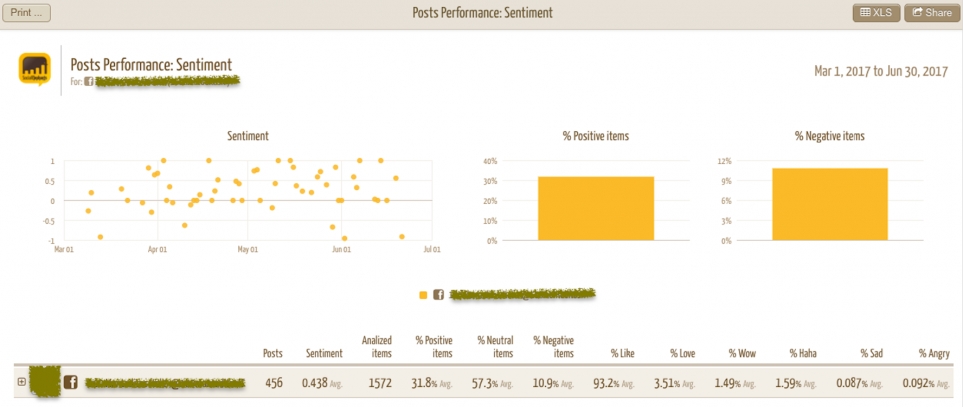
- Sentiment Analysis (Sentiment y Engagement & Sentiment)
- Best days / hours to publish (Best Time to Publish y Best Day to Publish)
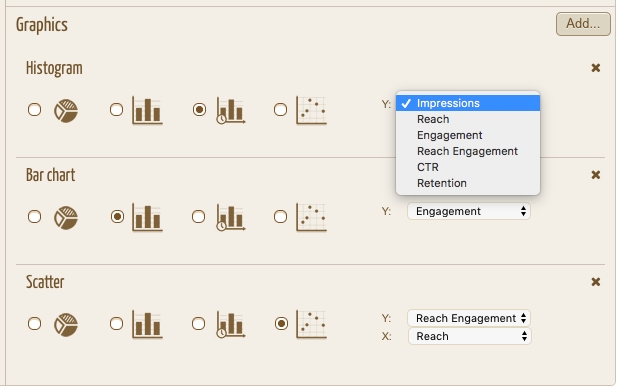
The templates reflect the most common needs and serve as inspiration for your analysis. In addition, there is the possibility to customize the reports by selecting the desired metrics, using the filters and adjusting the graphs according to your needs, choosing among the different modalities of data representation (pie chart, histograms, time series, scatter).
Here you can see some examples of reports that can be extracted with just one click:
Performance analysis of the different formats
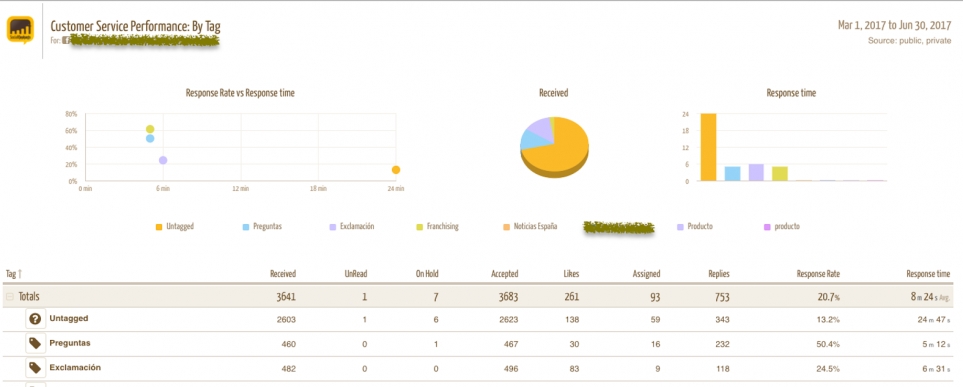
Analysis of the Customer Service activity
Sentiment Analysis
We invite you to visit our reports section and try our new fantastic options.